
Bitcoin Post-Halving 2024: Supply Dynamics, Network Security, and Bitcoin ETF

1. Introduction:
Bitcoin, often referred to as "digital gold," has revolutionized the world of finance since its inception in 2009. Created by the mysterious entity, Satoshi Nakamoto, Bitcoin introduced the concept of a decentralized digital currency that operates without the need for traditional financial intermediaries, such as banks or governments. This peer-to-peer electronic cash system not only challenged traditional financial systems but also introduced the groundbreaking technology of blockchain, which has since found applications far beyond just cryptocurrency.
Historically, Bitcoin has experienced several significant events known as "halvings." These halvings, occurring approximately every four years, reduce the number of new bitcoins created and earned by miners by half. They play a pivotal role in Bitcoin's economic model, ensuring its scarcity and deflationary nature. Each halving has historically been associated with significant price movements, often leading to new all-time highs in the months following the event.
The upcoming 2024 halving has garnered significant attention from the crypto community and financial analysts alike. A recent prediction from BitQuant, a popular social media commentator, suggests that Bitcoin will not only surpass its previous all-time high before the halving but will also potentially reach a staggering $250,000 per coin after the next halving cycle begins. Such bullish predictions are further supported by analyses from firms like Blockware Solutions, which suggest that the 2024 halving could propel Bitcoin's price to an astounding $400,000. They attribute this potential surge to a combination of reduced sell-off pressures from miners and an increased demand, especially with dwindling Bitcoin supplies on exchanges.
As we approach this significant event, it's essential to understand the myriad factors at play. The 2024 halving comes at a time when institutional interest in Bitcoin is at an all-time high, and the landscape of cryptocurrency regulation is rapidly evolving. These factors, combined with the inherent supply reduction of the halving, could have profound implications for Bitcoin's price, adoption, and its role in the broader financial ecosystem.

In the image above, the vertical blue lines indicate the previous three halvings (2012, 2016, and 2020). Note how the price has jumped significantly after each halving.
2. The Uniqueness of Bitcoin's Supply Curve:
Bitcoin's supply curve is unlike any other asset in the world. It is characterized by a hard-capped limit of 21,000,000 coins that will ever exist. This scarcity is a fundamental aspect of its value proposition, ensuring that, unlike fiat currencies, Bitcoin cannot be debased through arbitrary issuance.
A visual representation of Bitcoin's supply can be broken down into three main components:
🟠 Circulating Supply: This represents the cumulative amount of Bitcoin that has been mined and is currently in circulation. As of now, over 19 million bitcoins have been mined, accounting for more than 90% of the total supply.
🔴 Remaining Supply: This indicates the number of coins left to be mined. With the last Bitcoin expected to be mined around the year 2140, it underscores the decreasing rate of new Bitcoin entering the market.
🔵 Percentage of 21M Bitcoin Supply Mined: This provides a visual representation of how much of the total supply has been mined to date.

The deterministic nature of Bitcoin's supply curve is maintained by a brilliant mechanism known as the Difficulty Adjustment. This algorithm adjusts the complexity of the mining process to ensure that, regardless of the amount of mining power applied, the average time taken to mine a block remains approximately 10 minutes. This consistent block interval is crucial for maintaining the security and stability of the network.
Within the realm of commodities, when the price of an asset like gold rises, there's an economic incentive for miners to mine more of it, leading to an increase in the supply. This increased supply can then exert a downward pressure on the price, creating a self-regulating mechanism. Bitcoin, however, operates on a different paradigm. Its supply is pre-determined and cannot be influenced by external market dynamics. No matter how high the price of Bitcoin goes, the rate at which new bitcoins are introduced into the system remains unchanged, except for the periodic halvings. This inelastic supply, combined with increasing demand, can lead to significant price surges, as the market cannot be flooded with new bitcoins even in a bullish phase. This unique characteristic sets Bitcoin apart from traditional commodities and underpins its value proposition as a store of value. In my opinion, it’s the greatest asset in human history.
3. Bitcoin Issuance and Inflation Rate:
Bitcoin's issuance model is both transparent and predictable. At its inception, every block added to the blockchain rewarded miners with 50 bitcoins. This reward, however, is not constant. Every 210,000 blocks, or approximately every four years, this reward is halved in an event aptly named the "halving." This mechanism ensures that the total supply of Bitcoin will never exceed 21 million.
The halving events have profound implications on Bitcoin's inflation rate. Initially, with a reward of 50 bitcoins per block, the inflation rate was relatively high. But with each halving, the number of new bitcoins entering circulation reduces, leading to a decrease in the inflation rate.
For instance:
In the 2012 halving, the block reward dropped from 50 bitcoins to 25.
In 2016, it further reduced to 12.5 bitcoins.
The most recent halving in May 2020 saw the reward drop from 12.5 to 6.25 bitcoins per block.
The upcoming 2024 halving will reduce the reward from 6.25 bitcoins to just 3.125 bitcoins per block.
Below you can see the block rewards until the year 2140.

Bitcoin’s Transparent and Auditable Monetary Policy
The Inflation Rate is calculated by dividing the daily issuance of newly minted coins by the circulating supply. This gives an annual rate of supply expansion. As the block subsidy reduces with each halving, the inflation rate also sees a corresponding decline. This diminishing inflation rate, combined with the capped supply, reinforces Bitcoin's deflationary nature.
In the image below, you can see Bitcoin's inflation rate during each period.

Each halving lowers Bitcoin's inflation rate. The orange line is Bitcoin's inflation rate during a given period, while the blue line is the total number of bitcoins issued.
The impact of the halving on Bitcoin's price is often a topic of debate among analysts. Historically, the reduced supply of new bitcoins, combined with steady or increasing demand, has led to bullish market cycles post-halving. The anticipation of this reduced supply acts as a catalyst, driving speculative interest and investment in the months leading up to the halving.
4. Supply Dynamics: Old Coins vs. Young Coins:
Bitcoin's ledger, the blockchain, provides a transparent record of all transactions, allowing for a detailed analysis of the age of coins in circulation. This analysis gives insights into the behavior of Bitcoin holders and their potential impact on the market.
Supply Last Active is a metric that categorizes bitcoins based on the last time they were moved in a transaction. This categorization provides a snapshot of investor sentiment and behavior:
Supply Last Active 1+ Yrs Ago (🔴): These are coins that haven't moved in the last year. A rise in this metric indicates a growing number of long-term holders or "HODLers." These investors believe in Bitcoin's long-term value proposition and are less likely to sell in the short term.
Supply Last Active 2+ Yrs Ago (🟠), 3+ Yrs Ago (🟢), and 5+ Yrs Ago (🔵): These metrics further segment the long-term holders. An increase in these metrics can indicate a strengthening conviction among investors, while a decrease might suggest that long-held coins are being sold or moved.

On the flip side, coins that have transacted recently are termed as 'young coins'.
Supply Last Active < 6-months: These are coins that have moved in the last six months. An increase in this metric can indicate heightened trading activity, possibly due to new entrants in the market or existing investors trading their holdings.
Two primary events typically lead to a surge in young coin volumes:
Bull Markets: During bullish phases, long-term investors might decide to realize profits, leading to older coins becoming young again.
Capitulation Events: In times of market panic, coins of all ages might be sold, leading to a spike in young coin volumes.
Understanding the dynamics between old and young coins can provide insights into market sentiment. A rising percentage of old coins suggests a growing hodler base, which can be a bullish indicator. Conversely, a significant increase in young coins might indicate potential selling pressure.
5. Lost Coins: A Deep Dive:
Bitcoin's decentralized nature and cryptographic security come with a unique challenge: coins can be lost forever if users lose access to their private keys. Over the years, a significant number of bitcoins have been deemed 'lost' due to various reasons.
Probably Lost Supply: This refers to the so-called "zombie coins." These are coins that have remained inactive since the launch of the first BTC exchange in July 2010. While there's a possibility that these coins might still be spent, the longer they remain inactive, the higher the likelihood that they are lost. This category also includes the "Patoshi" coins, which have never been moved and are believed to be owned by Bitcoin's mysterious creator, Satoshi Nakamoto.
Provably Lost Supply: These are bitcoins that are verifiably lost and can never be spent. They fall into one of the following categories:
Unclaimed Miner Rewards: Miners are allowed to claim less than the specified block subsidy reward, leading to these unclaimed rewards being lost.
BTC sent to Burn Addresses: These are addresses whose private keys are provably unowned, making the bitcoins sent to them irretrievable.
BTC sent to 'OP_RETURN': This is a script opcode used primarily for storing data on the blockchain. Coins sent to this opcode are provably unspendable as they don't get added to the UTXO set.

Estimates suggest that between 3 to 4 million bitcoins are potentially lost forever. This means that out of the 21 million maximum supply, only around 17-18 million bitcoins are effectively in circulation. This realization underscores Bitcoin's scarcity, making it even more valuable. The concept of lost coins is crucial in understanding Bitcoin's effective circulating supply. While the theoretical maximum supply of Bitcoin is 21 million, the actual number of bitcoins available for use is significantly lower due to these lost coins. This inherent scarcity, combined with increasing demand, is a fundamental driver of Bitcoin's value proposition.
6. Supply in Profit/Loss:
Every Bitcoin transaction is recorded on the blockchain, allowing for a detailed analysis of when each coin was last moved. By comparing this with the price at the time of the last movement, one can determine whether a coin is currently in profit or loss.
Pricestamping of UTXOs: This process involves assigning a price to a UTXO (Unspent Transaction Output) based on the time it was created. This price is assumed to be the acquisition cost of the coin.
By comparing the pricestamp of each UTXO with the current price, one can categorize the supply into:
Supply in Profit: Coins that were last moved when the price was lower than the current price.
Supply in Loss: Coins that were last moved when the price was higher than the current price.

Large shifts in the Supply in Profit/Loss, especially with relatively small price changes, can indicate significant volumes of coins were transacted around that price region. This is typical after extended market consolidation periods where many coins change hands. Understanding these dynamics can provide insights into market sentiment and potential future price movements.
7. Network Security and Decentralization:
Bitcoin's security is paramount to its value and trustworthiness. The network's security is maintained by miners who use computational power to validate and add transactions to the blockchain. This computational power, measured in hashes per second, ensures that the network remains resistant to attacks and tampering.
Bitcoin Hashrate: As of September 16, 2023, the Bitcoin network boasts a staggering hashrate of 502.11 EH/s (ExaHash per second), which equates to 502,108,461,546,938,400,000 hashes every second. This immense computational power is a testament to the decentralized nature and robustness of the Bitcoin network. For context, the combined computational power of tech giants like Meta, Amazon, Google, Microsoft, and Apple pales in comparison to the Bitcoin network, making it virtually unhackable.
The Bitcoin hashrate represents the number of hashes being generated by Bitcoin miners trying to solve the current Bitcoin block or any given block. As the Bitcoin network hashrate increases, it signifies more miners are participating, further strengthening the network's security and decentralization.
Hashrate Units: The Bitcoin hashrate is so vast that it's measured in units ranging from H/s (one hash per second) to YH/s (one septillion hashes per second). The current hashrate of 502.11 EH/s falls into the ExaHash category, which represents one quintillion hashes per second.

It's essential to understand that the Bitcoin hashrate doesn't determine how quickly blocks are solved. This timing, known as the block time, is governed by the Bitcoin mining difficulty, which adjusts to keep block solutions at a consistent timeframe.
Significance: The unparalleled hashrate of the Bitcoin network, combined with its decentralized nature, ensures that no single entity can control or tamper with the network. Potential threats, such as 51% attacks, are rendered almost impossible due to the sheer computational power required. As more miners join the network, its security and decentralization are further reinforced, making Bitcoin one of the most secure digital assets in existence.
8. The Potential Impact of Major Firms Entering the Bitcoin Market:
Brief Overview of the Significance of Bitcoin Spot ETFs:
Exchange-Traded Funds (ETFs) have long been a staple in traditional financial markets, allowing investors to buy a basket of assets without having to purchase each one individually. A Bitcoin spot ETF, specifically, would track the price of Bitcoin directly and would involve the actual purchase of the cryptocurrency. This means that as more investors buy into the ETF, more Bitcoin would be purchased on the open market, potentially driving up demand and, subsequently, the price.
Potential Influx of Capital Due to Bitcoin ETFs:
The entry of major financial firms into the Bitcoin market via spot ETFs can lead to a significant influx of capital. These firms, with their vast resources and client bases, can introduce a new segment of institutional and retail investors to Bitcoin. This not only provides a more straightforward and regulated way for investors to gain exposure to Bitcoin but also enhances the legitimacy and acceptance of the cryptocurrency in traditional financial circles.
Table and Analysis by Invest Answers Detailing the Impact of Major Firms on Bitcoin's Price:
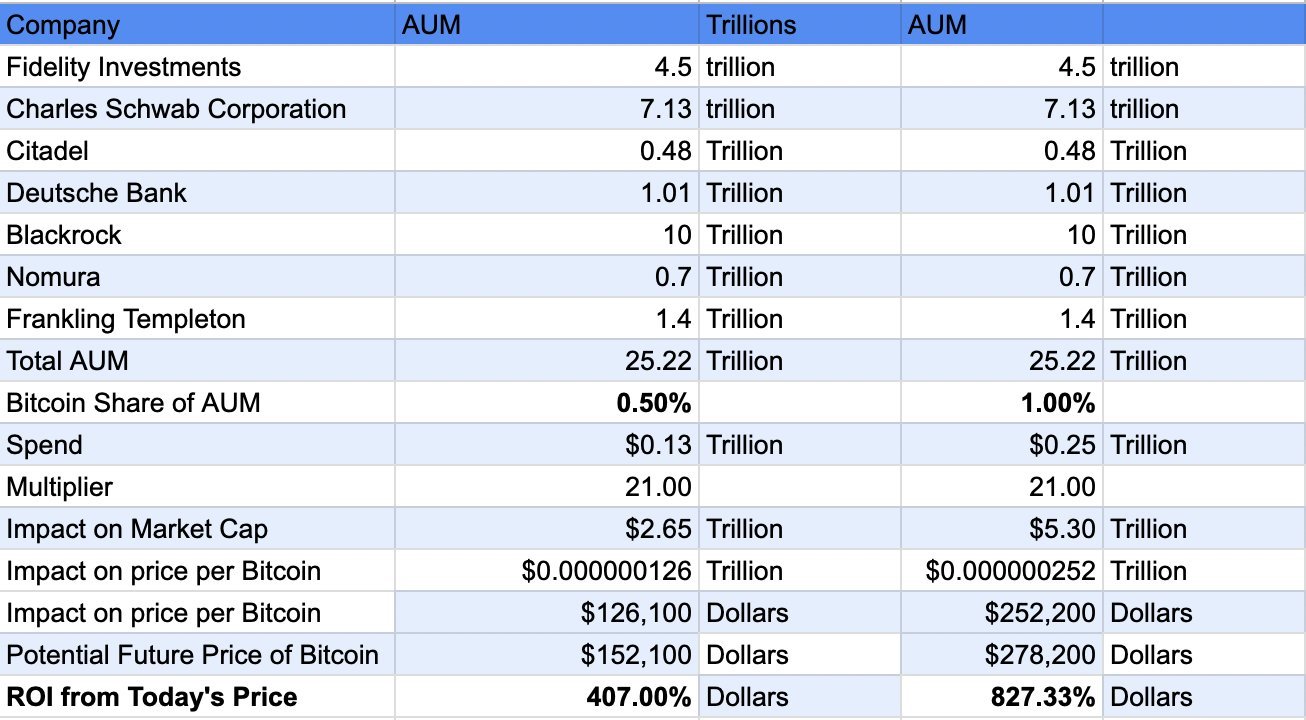
The entry of major firms and the establishment of Bitcoin spot ETFs could act as a catalyst, driving unprecedented demand and capital inflow into the Bitcoin market. The above table showcases the potential impact of these major firms entering the Bitcoin market. If all the listed firms were to allocate a portion of their AUM to Bitcoin, the cumulative effect could be monumental. The potential future price of Bitcoin, as indicated, could see significant growth, offering substantial returns on investment while solidifying its position as a premier investment asset.
9. Conclusion:
Bitcoin's journey since its inception in 2009 has been nothing short of remarkable. From being an obscure digital currency to becoming the world's most recognized and valuable cryptocurrency, its trajectory has been meteoric. The upcoming 2024 halving event is poised to mark another pivotal chapter in Bitcoin's illustrious history. With its unique supply dynamics, surging demand, and unparalleled security, Bitcoin stands out as a revolutionary asset in the financial realm. Its potential post-halving implications, combined with the anticipated influx of capital from major firms and the imminent approval of Bitcoin spot ETFs, further solidify its position as a store of value and a hedge against traditional financial systems. For those who recognize the signs, the opportunity to front-run the spot ETF approval is now, presenting one of the greatest investment opportunities of our time.
10. Call to Action:
For hedge funds and institutional investors looking to navigate the intricacies of the Bitcoin market, especially in anticipation of the 2024 halving and the potential approval of spot ETFs, expert guidance is indispensable. At Digital Assets Consult, we pride ourselves on offering deep insights, strategic advice, and a comprehensive understanding of the Bitcoin landscape. As the crypto ecosystem continues to evolve and present new opportunities, having a trusted partner can make all the difference. Partner with us to leverage the unmatched potential of Bitcoin and ensure you remain at the forefront of the ever-evolving world of digital assets. Contact us to learn more.